
Page 135 - Annual Report 2015 - Mono Technology Public Company Limited
P. 135
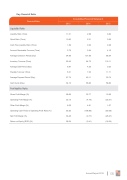
Key Financial Ratio
Financial Ratio
Quick Ratio (Time)
Cash Flow Liquidity Ratio (Time)
Account Receivable Turnover (Time)
Average Collection Period (Day)
Inventory Turnover (Time)
Average Sale Period (Day)
Payable Turnover (Time)
Average Payment Period (Day)
Cash Cycle (Day)
Profitability Ratio
Gross Profit Margin (%)
Operating Profit Margin (%)
Other Profit Margin (%)
Operating Cash Flows to Operating Profit Ratio (%)
Net Profit Margin (%)
Return on Equity (ROE) (%)
1.69
3.79
94.99
52.42
6.87
5.31
67.74
34.12
58.66
32.13
6.05
92.52
33.45
28.24
Consolidated Financial Statements
Liquidity Ratio
Liquidity Ratio (Time)
2013
11.01
10.60
2014
2.58
2.31
0.32
3.54
101.69
84.73
4.25
7.33
49.11
56.83
33.77
(4.76)
4.81
(198.86)
(0.77)
(0.41)
2015
0.82
0.59
0.28
4.16
86.54
119.11
3.02
11.71
30.74
58.82
12.69
(23.21)
1.67
(53.09)
(25.27)
(18.24)
Annual Report 2015
135
